Visualizations from 7B Software, Inc.
We deliver delightful visualizations to folks who need to see things clearly.
I'm very impressed with the D3 javascript framework, used to generate powerful, animated visualizations in the browser.
In addition, the ReactJS user interface library and Redux state container make for a powerful Functional Programming environment.
Finally, the mongodb NoSQL database, and the NodeJS environment allow us to create a high-performance mid-tier and back-end that is 100% (CommonJS) javascript.
The app has the following interesting properties:
React/Redux are used to manage user events and generate DOM changes. The app leverages the tools so that pure functions can be leveraged to great effect.
Input data is decoupled from presentation. There aren't any data-specific kludges in the javascript code. In addition:
A metadata layer ensures that data is decoupled from input controls. Adding a metadata table and joining it to the actual input is a clean method of describing whether particular data can be added to tooltips, used for pivots, or used for aggregation. This allows a single point of control for any dataset.
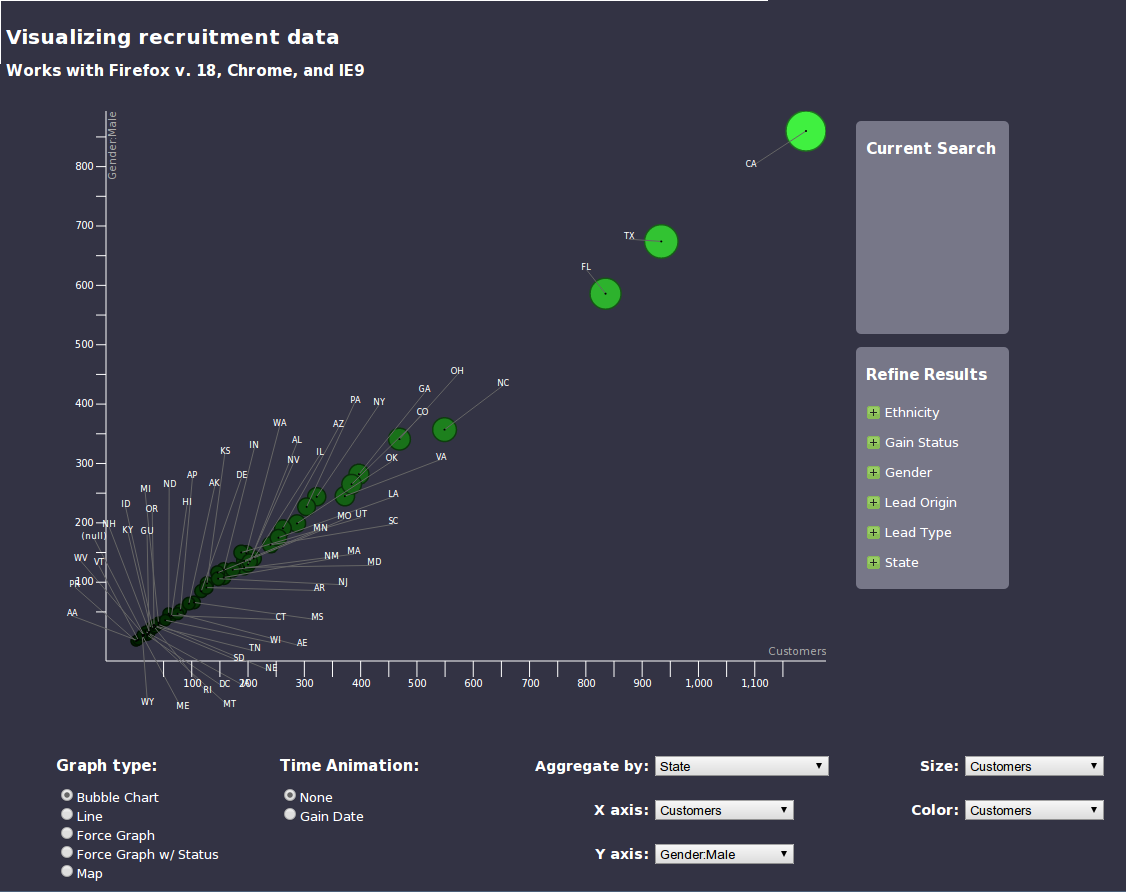
Label placement is a pretty hard problem, solved here with a force graph. A crowded graph presents a tricky label positioning issue. We use a force graph to force label names apart (as in the screenshot directly to the right).
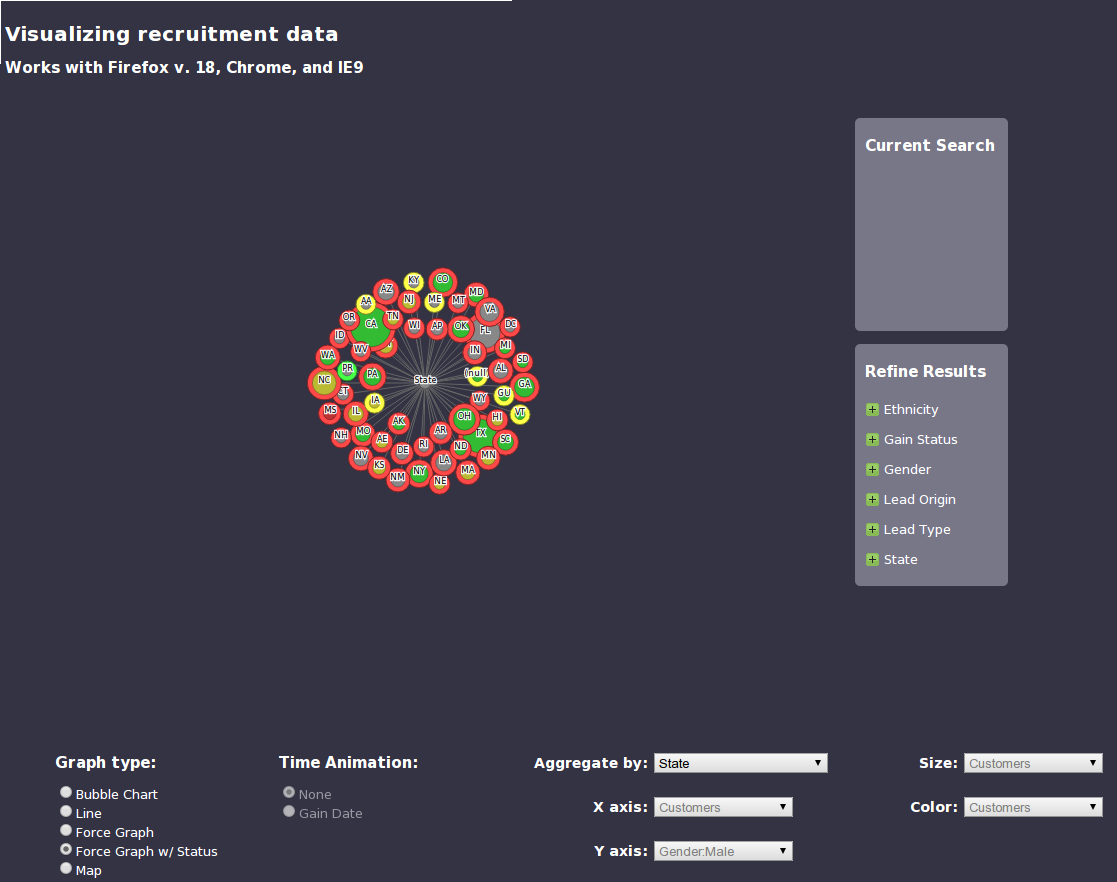
A force graph is also being used to model a simple network. In the app, the network is a simple hierarchy built from inherent parent-child relationships within the dataset.
The app supports auto-rollup of status within the network visualization. Statuses are plotted as red (bad), yellow (warning), green (ok), and gray (unknown). A parent node can have its own innate status, but it also displays (on its ringed outer border) the worst status of any of its descendents.
Data transforms use the mongodb aggregation pipeline, a super-efficient method for retrieving large datasets on the server. The aggregation pipeline handles filtering, pivoting, and aggregation. The work could have been done in the browser, but as the data scales, using fast-performing server techniques are better.
Mark Smith
7B Software, Inc.